Real-Time Google Trends Visuals for a Live Election Debate
Animated data visualizations shown on TV to highlight the most searched candidates and topics
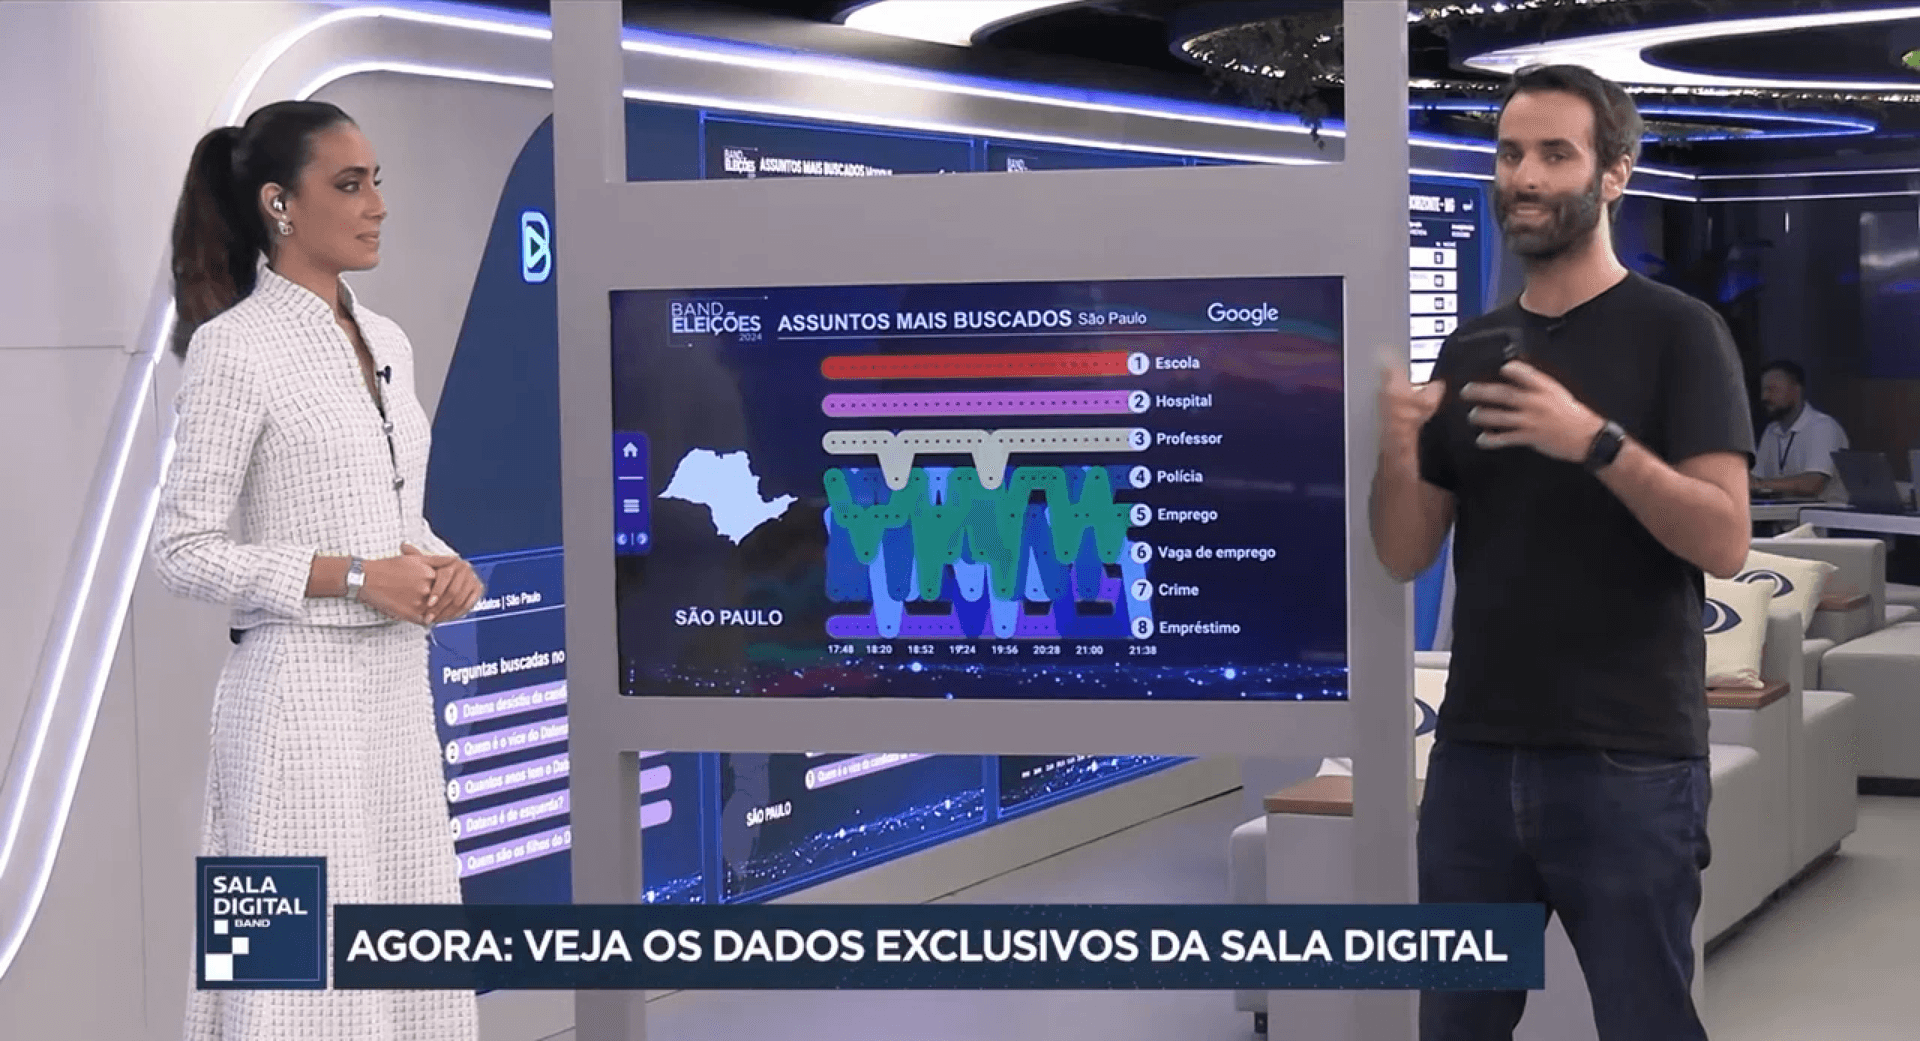
The Brazilian population casted their votes in municipal elections in October 2024. In advance of these elections, a debate between the leading candidates was held in São Paulo on August 8, 2024.
The live TV program from BAND broadcasting the debate was enhanced with a comprehensive live analysis of the most searched parties, candidates, and topics.
2024
Google Trends
Pitch Interactive
Animated data visualizations & infrastructure
Development, Infrastructure, Monitoring
Python, Google Cloud, D3
Part of the live TV broadcast on BAND (Source on Youtube, here shown without audio.)
A behind-the-scenes look at the newsroom published by the TV network BAND on Instagram (source)
In this project for Google Trends and BAND, I was responsible for the display of the trends data visualizations. I revived the previous project, upgraded it to the newest data infrastructure and proper visual appearance as well as monitored during the live event.
Seeing the data visualizations you're responsible for displayed with real-time data from Google Trends on live television halfway around the world was definitely a memorable moment for me.
See also
More Projects You Might Like
Inspired by what you see?
Let’s discuss how we can bring your data to life with a custom, interactive visualization.


