Visualizing Pathways to Better Childcare
An interactive guide to childcare options and policy implications for families.
In this project, I contributed an interactive visual to the "Childcare for All" website, a US-based website by NationSwell that advocates for childcare solutions for all workers (and especially frontline, part-time, gig, and shift workers).
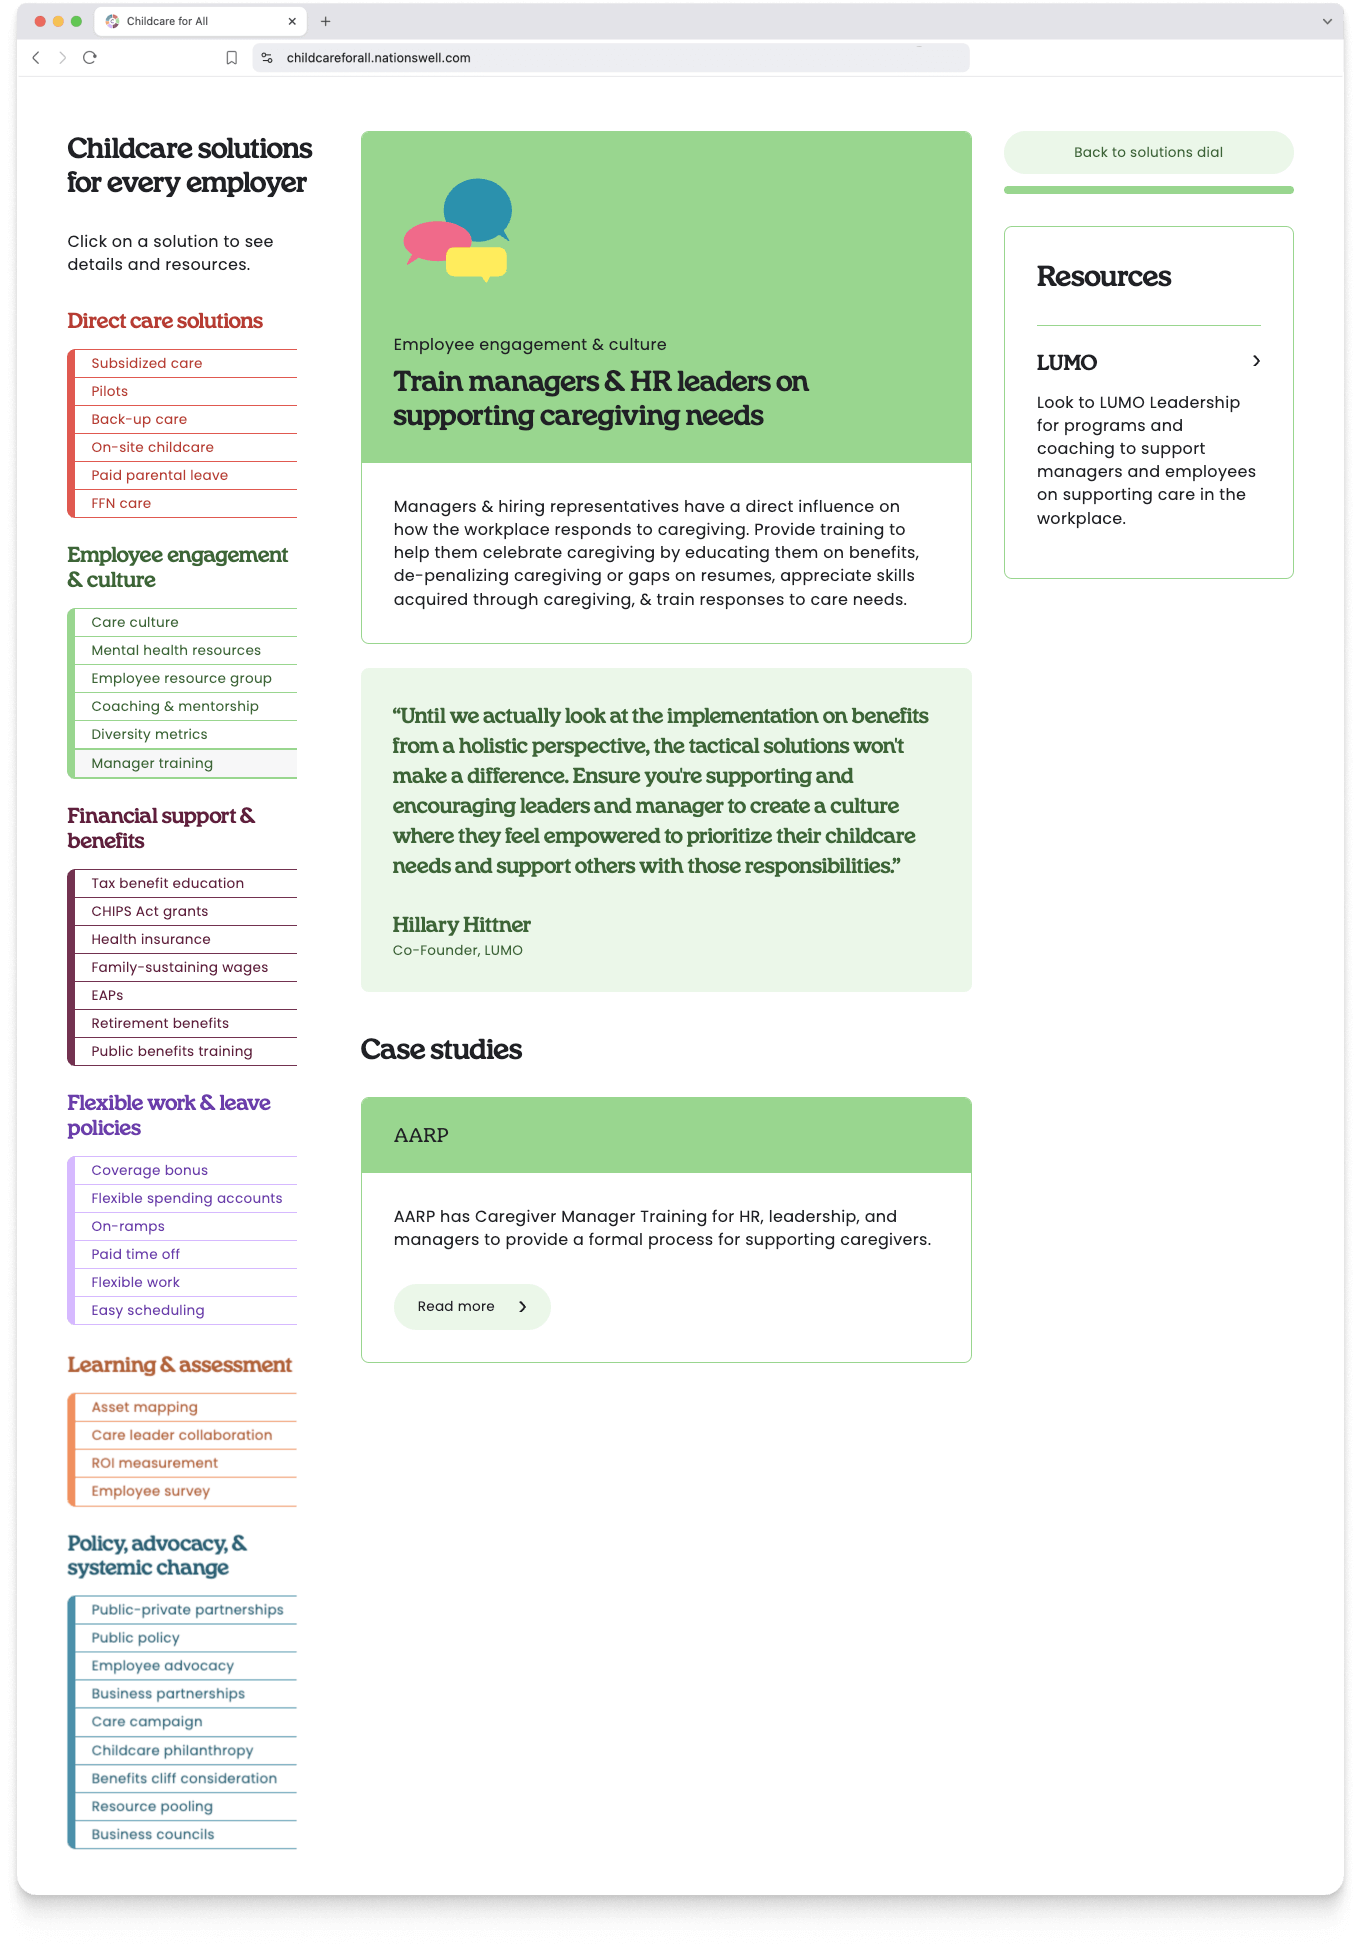
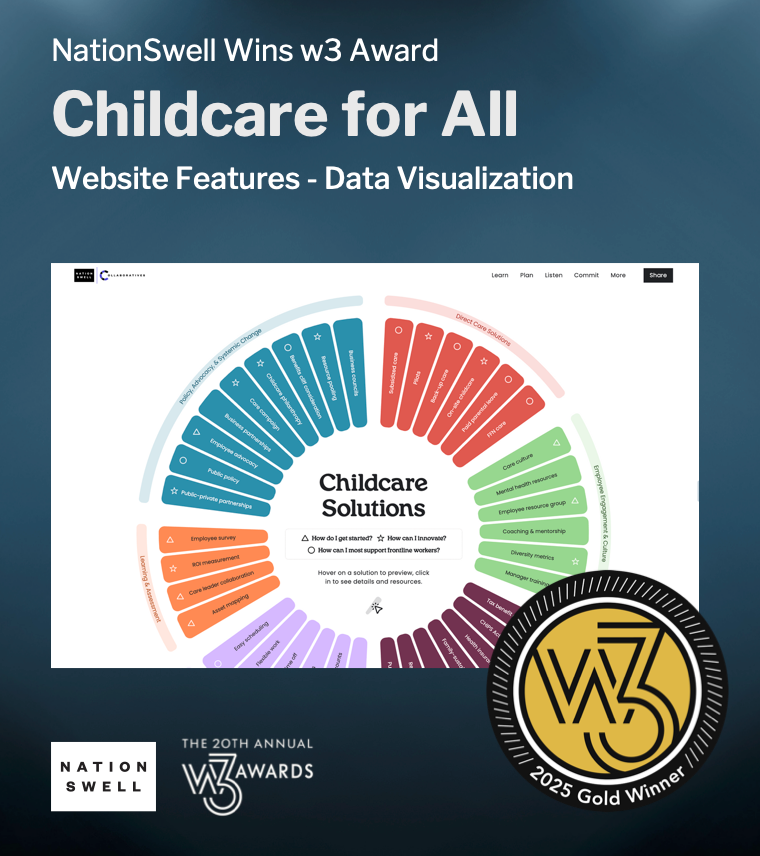
The radial visualization allows exploring the childcare options by hovering, as well as by opening a detail screen that highlights case studies, quotes, resources and more.
I coded this visualization using React and D3 and integrated it into a Webflow page, a smart solution for combining code and no-code tooling.
2024
NationSwell
Data Culture Studio
Standalone interactive visualization
Development of Data Viz, Integration with Webflow website
D3, React, Webflow integration
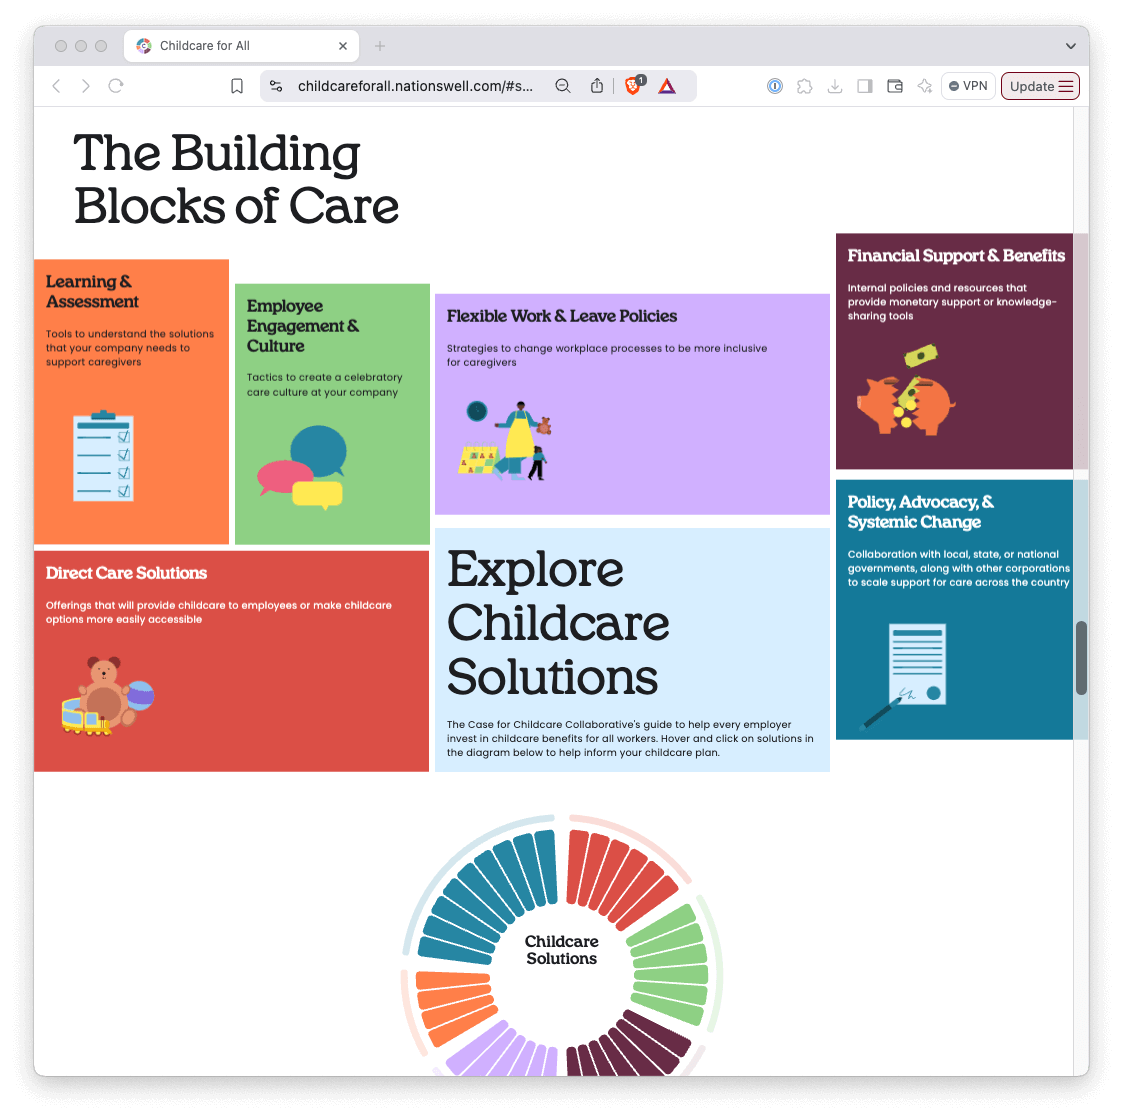
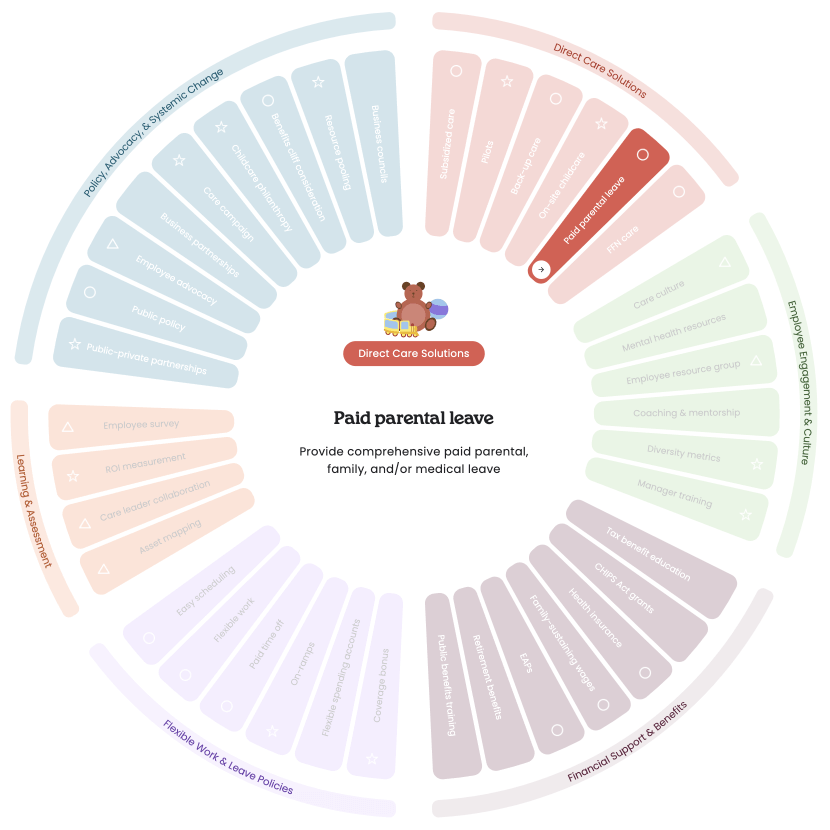
Working with Data Culture Studio, I coded this interactive "Childcare Solutions" visualization that walks employers through 35+ ways on how to get started in supporting parents and caregivers. These range from solutions like beginning with a needs and assets map of your company benefits through to conducting employee surveys, providing tax benefits education, forging public-private partnerships, implementing stipends or subsidized care, and many more.
And I am happy to report that this data visualization won the W3 Gold Award in 2025 in the category "Website Features - Best Use of Data Visualization" 🎉
See also
More Projects You Might Like
Inspired by what you see?
Let’s discuss how we can bring your data to life with a custom, interactive visualization.