Blooming - A Data Art Project on Poverty
A floral, organic visualization revealing how poverty risk varies across gender, age, and location across Pacific communities

"Blooming - Exploring Poverty in the Pacific Region" is an interactive, exploratory data visualization I created to explore the connection between poverty and gender inequality in the Pacific region.
It focuses on the question: "How does the risk of living in poverty vary by gender, age, and whether you live in an urban or rural area in a Pacific country?"
2024
Data art piece
Idea, Concept, Design, Development
Svelte, D3
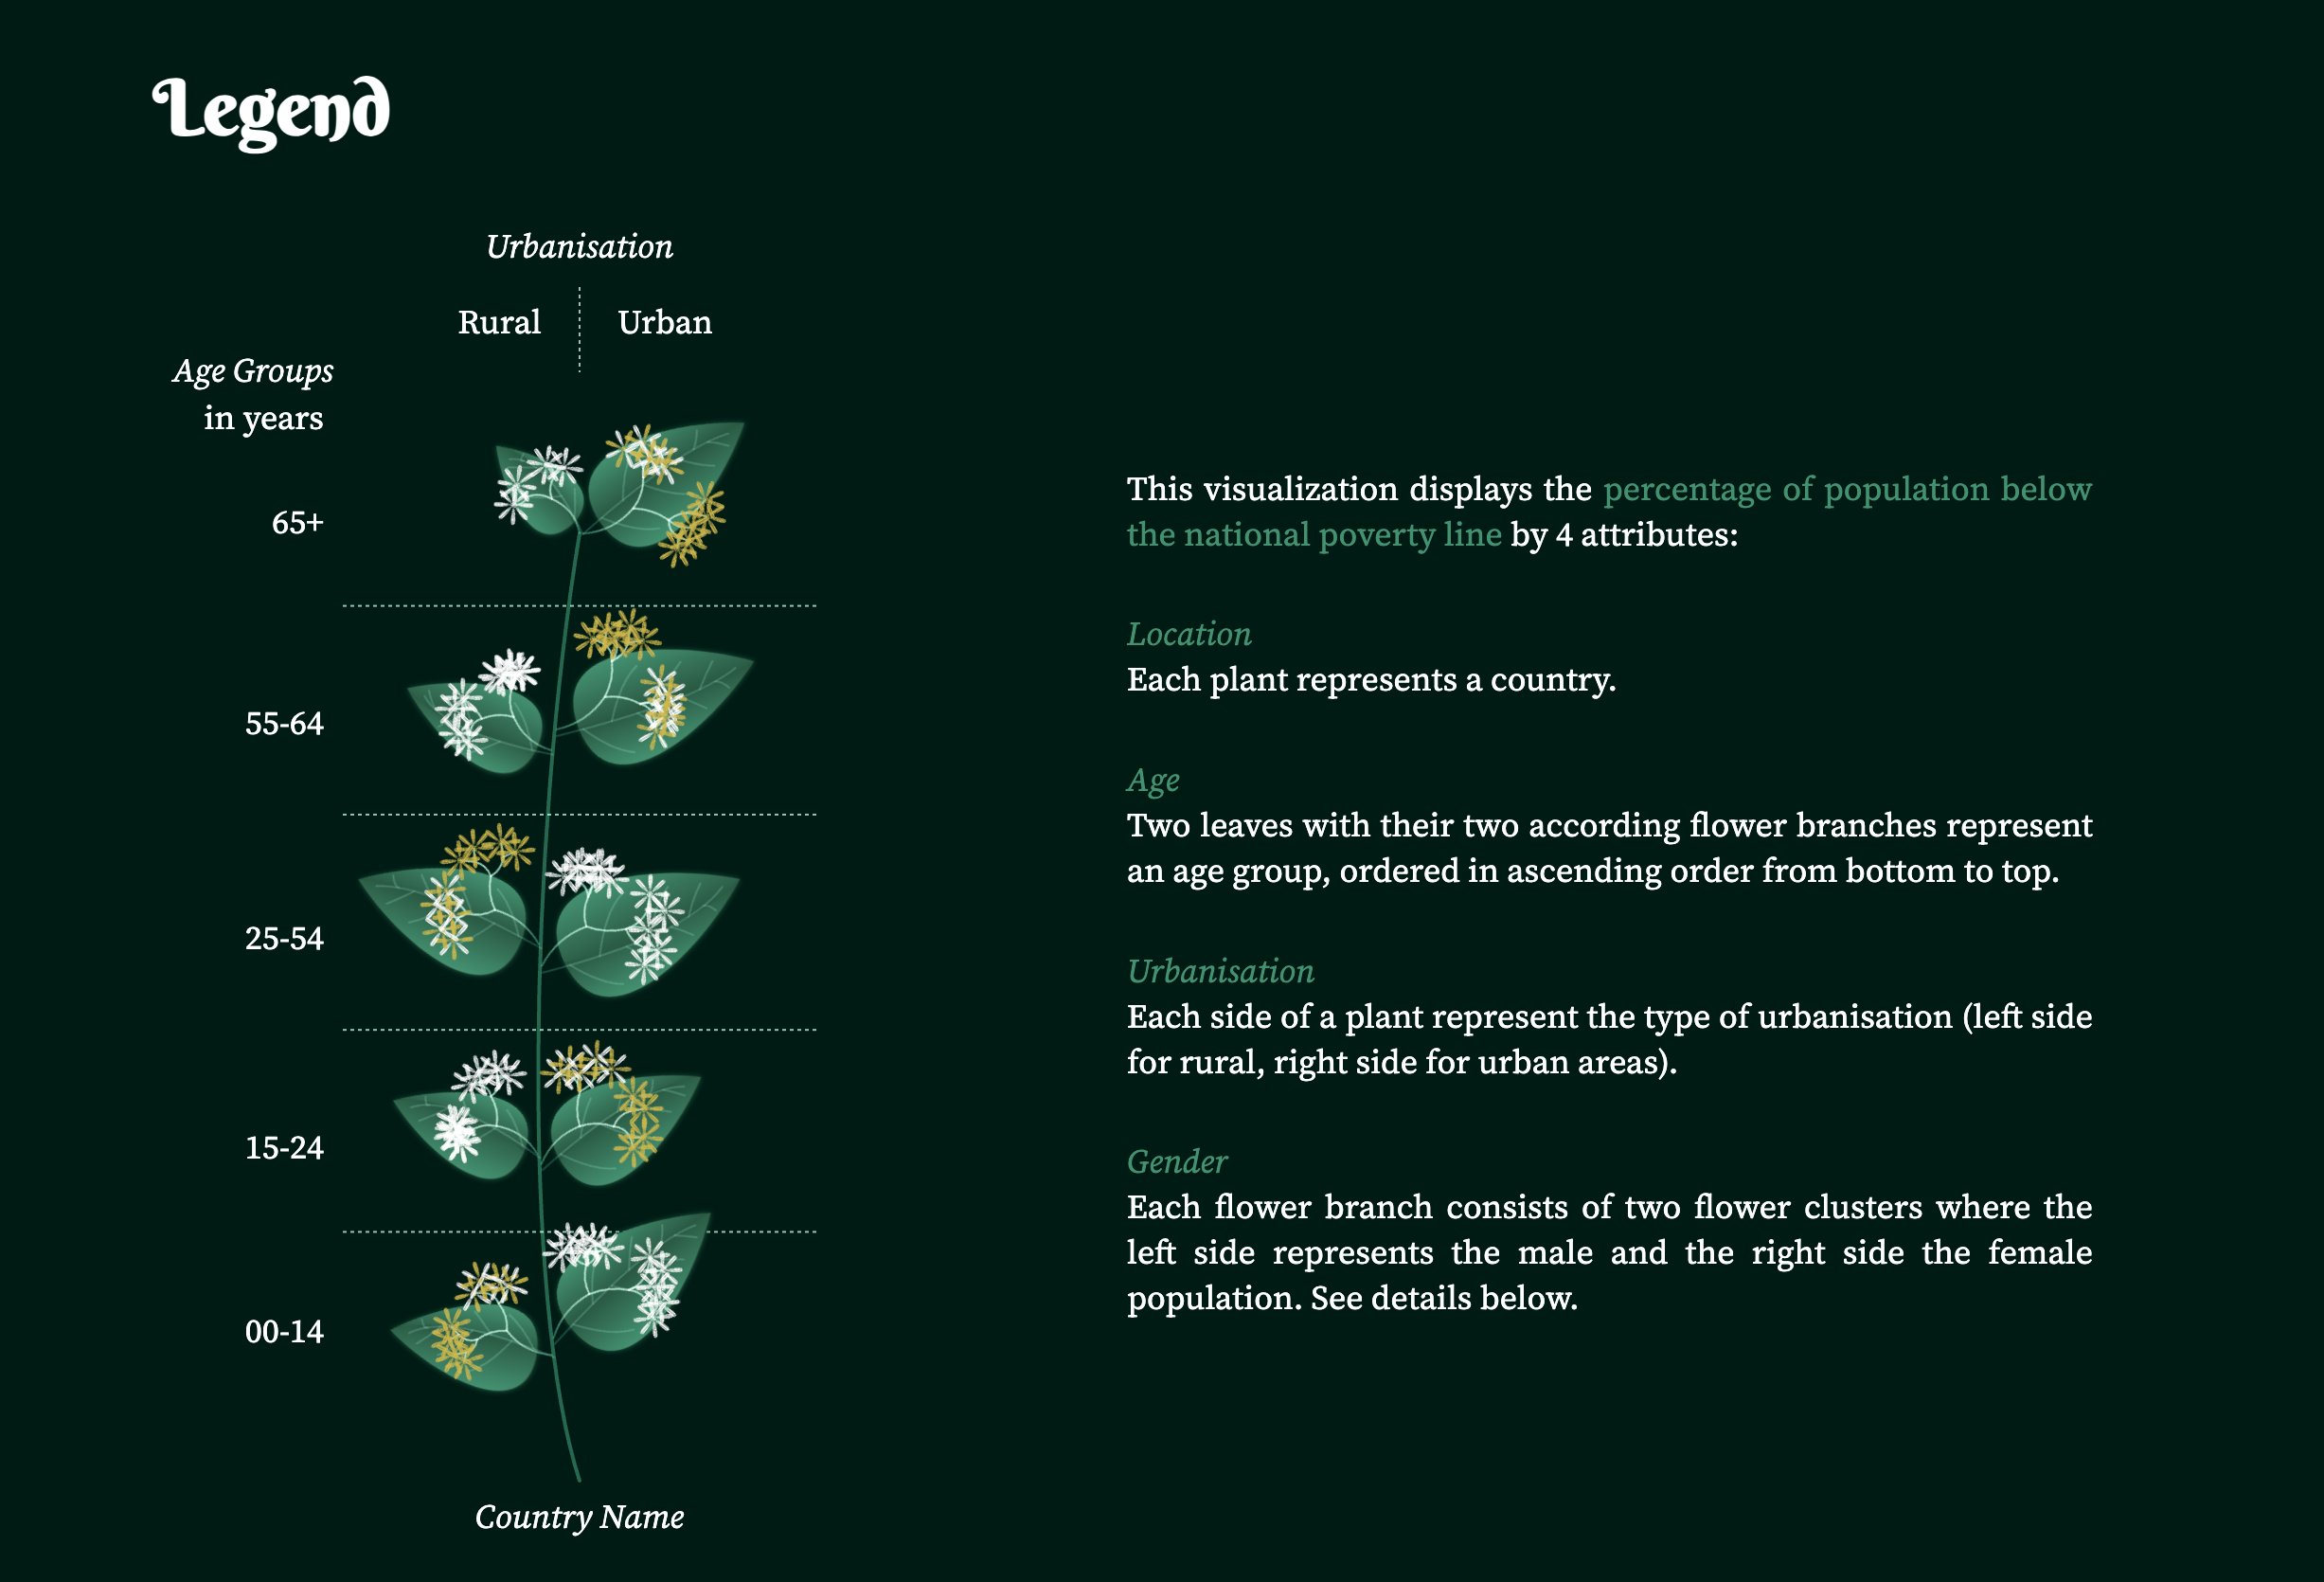
This visualization highlights the proportion of the population living below the national poverty line while looking at the attributes of gender, location, age, and urbanization.
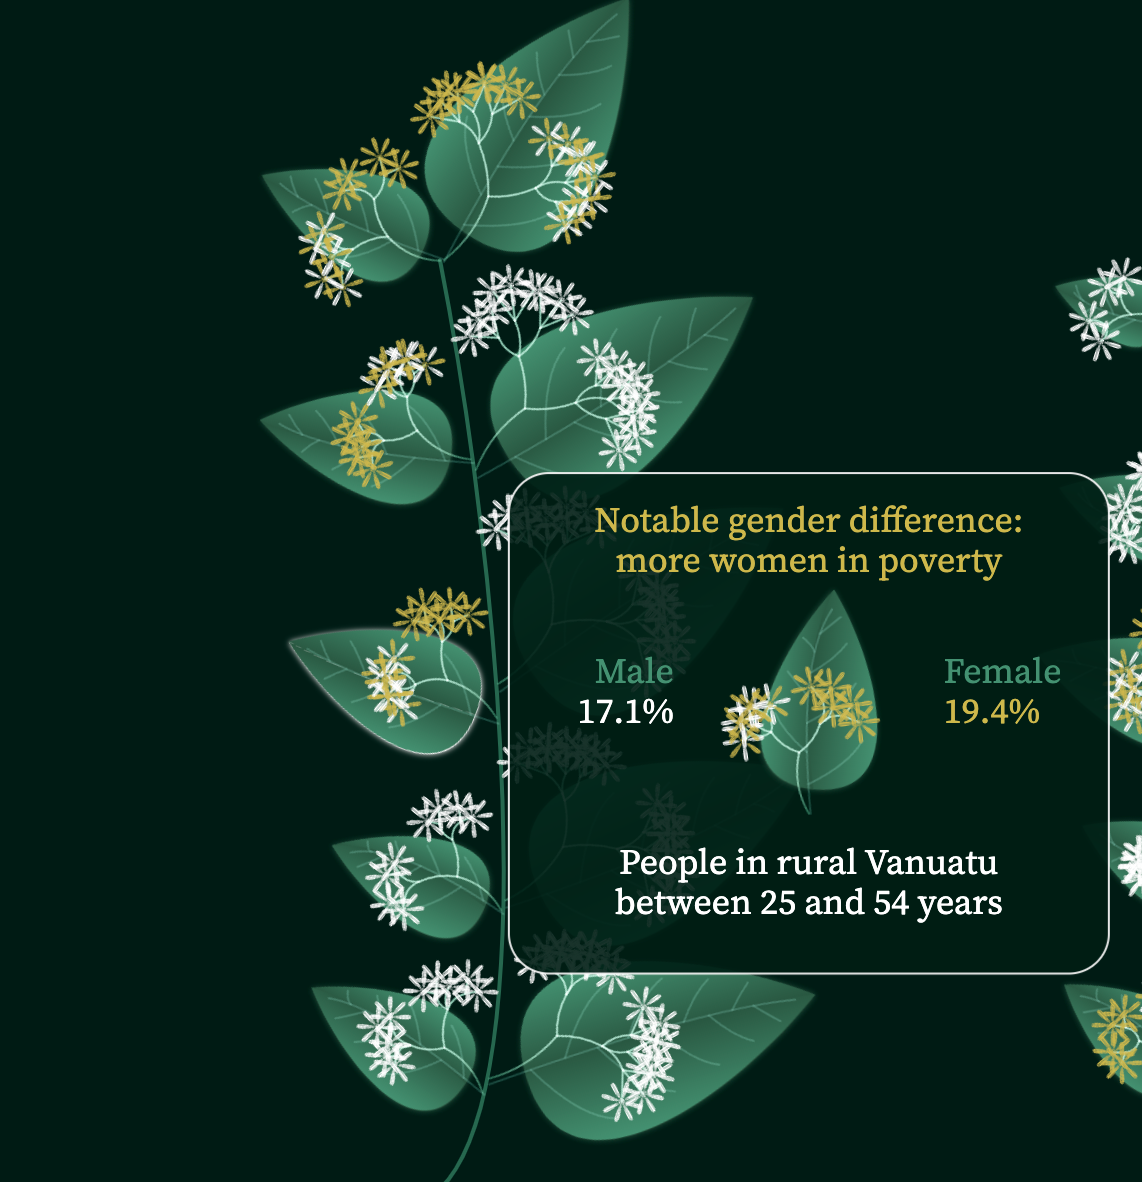
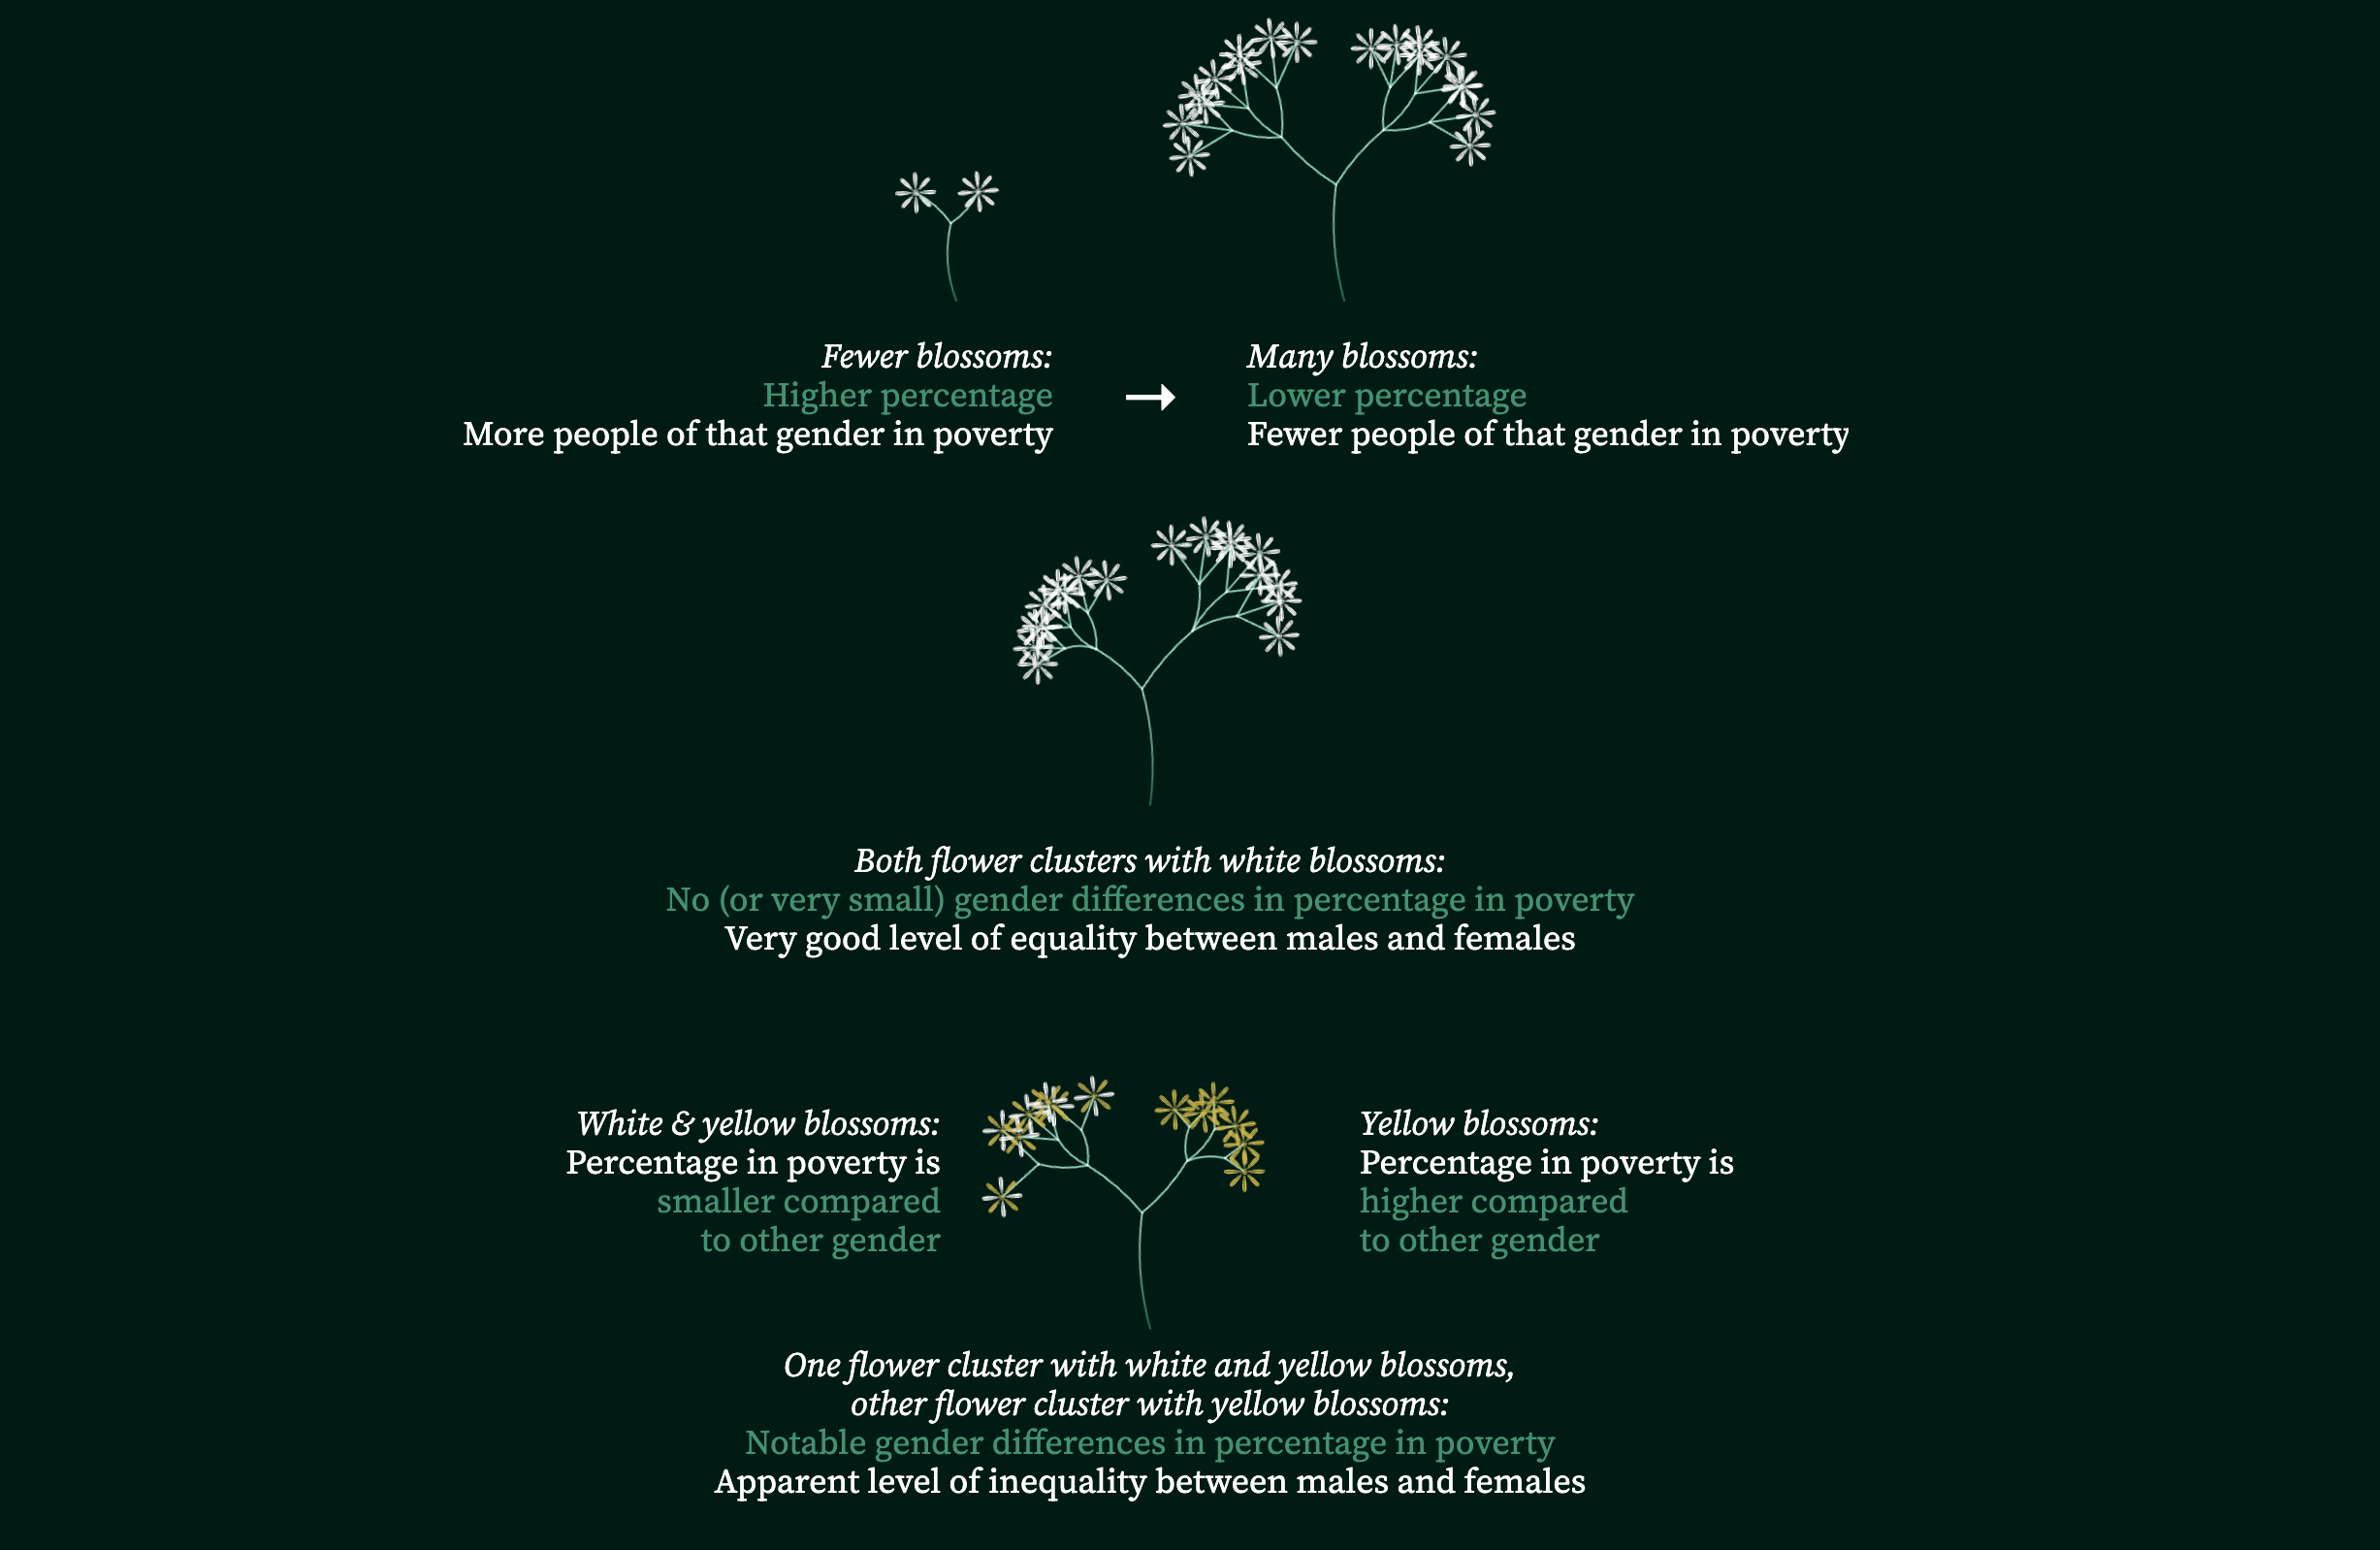
The project, titled "Blooming", uses the analogy of a plant with blooming flowers to symbolize growth and a journey out of poverty for all age groups, urbanization levels, and regions. A large flower with lots of blossoms shows that a group of people of a certain age in an either urban or rural area only rarely faces poverty. This community is blooming. By looking closer at the white-yellowish blossoms one can then explore the gender-based differences in facing poverty in detail via tooltips.
The stylized plant resembles the plant Amborella trichopoda which is only endemic to New Caledonia's forests and therefore cannot be found anywhere else on the planet. This metaphor also points out that the status quo of poverty related to gender, the reasons for such a status quo, and a way to reduce poverty is unique to the Pacific region while the data collection for indicators like the Sustainable Development Goals is done globally.
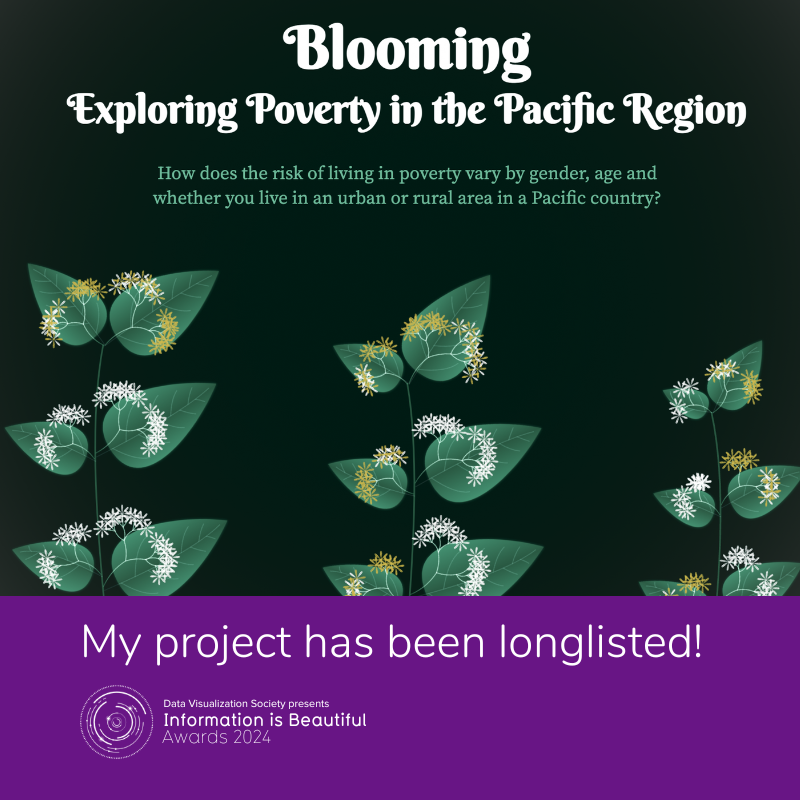
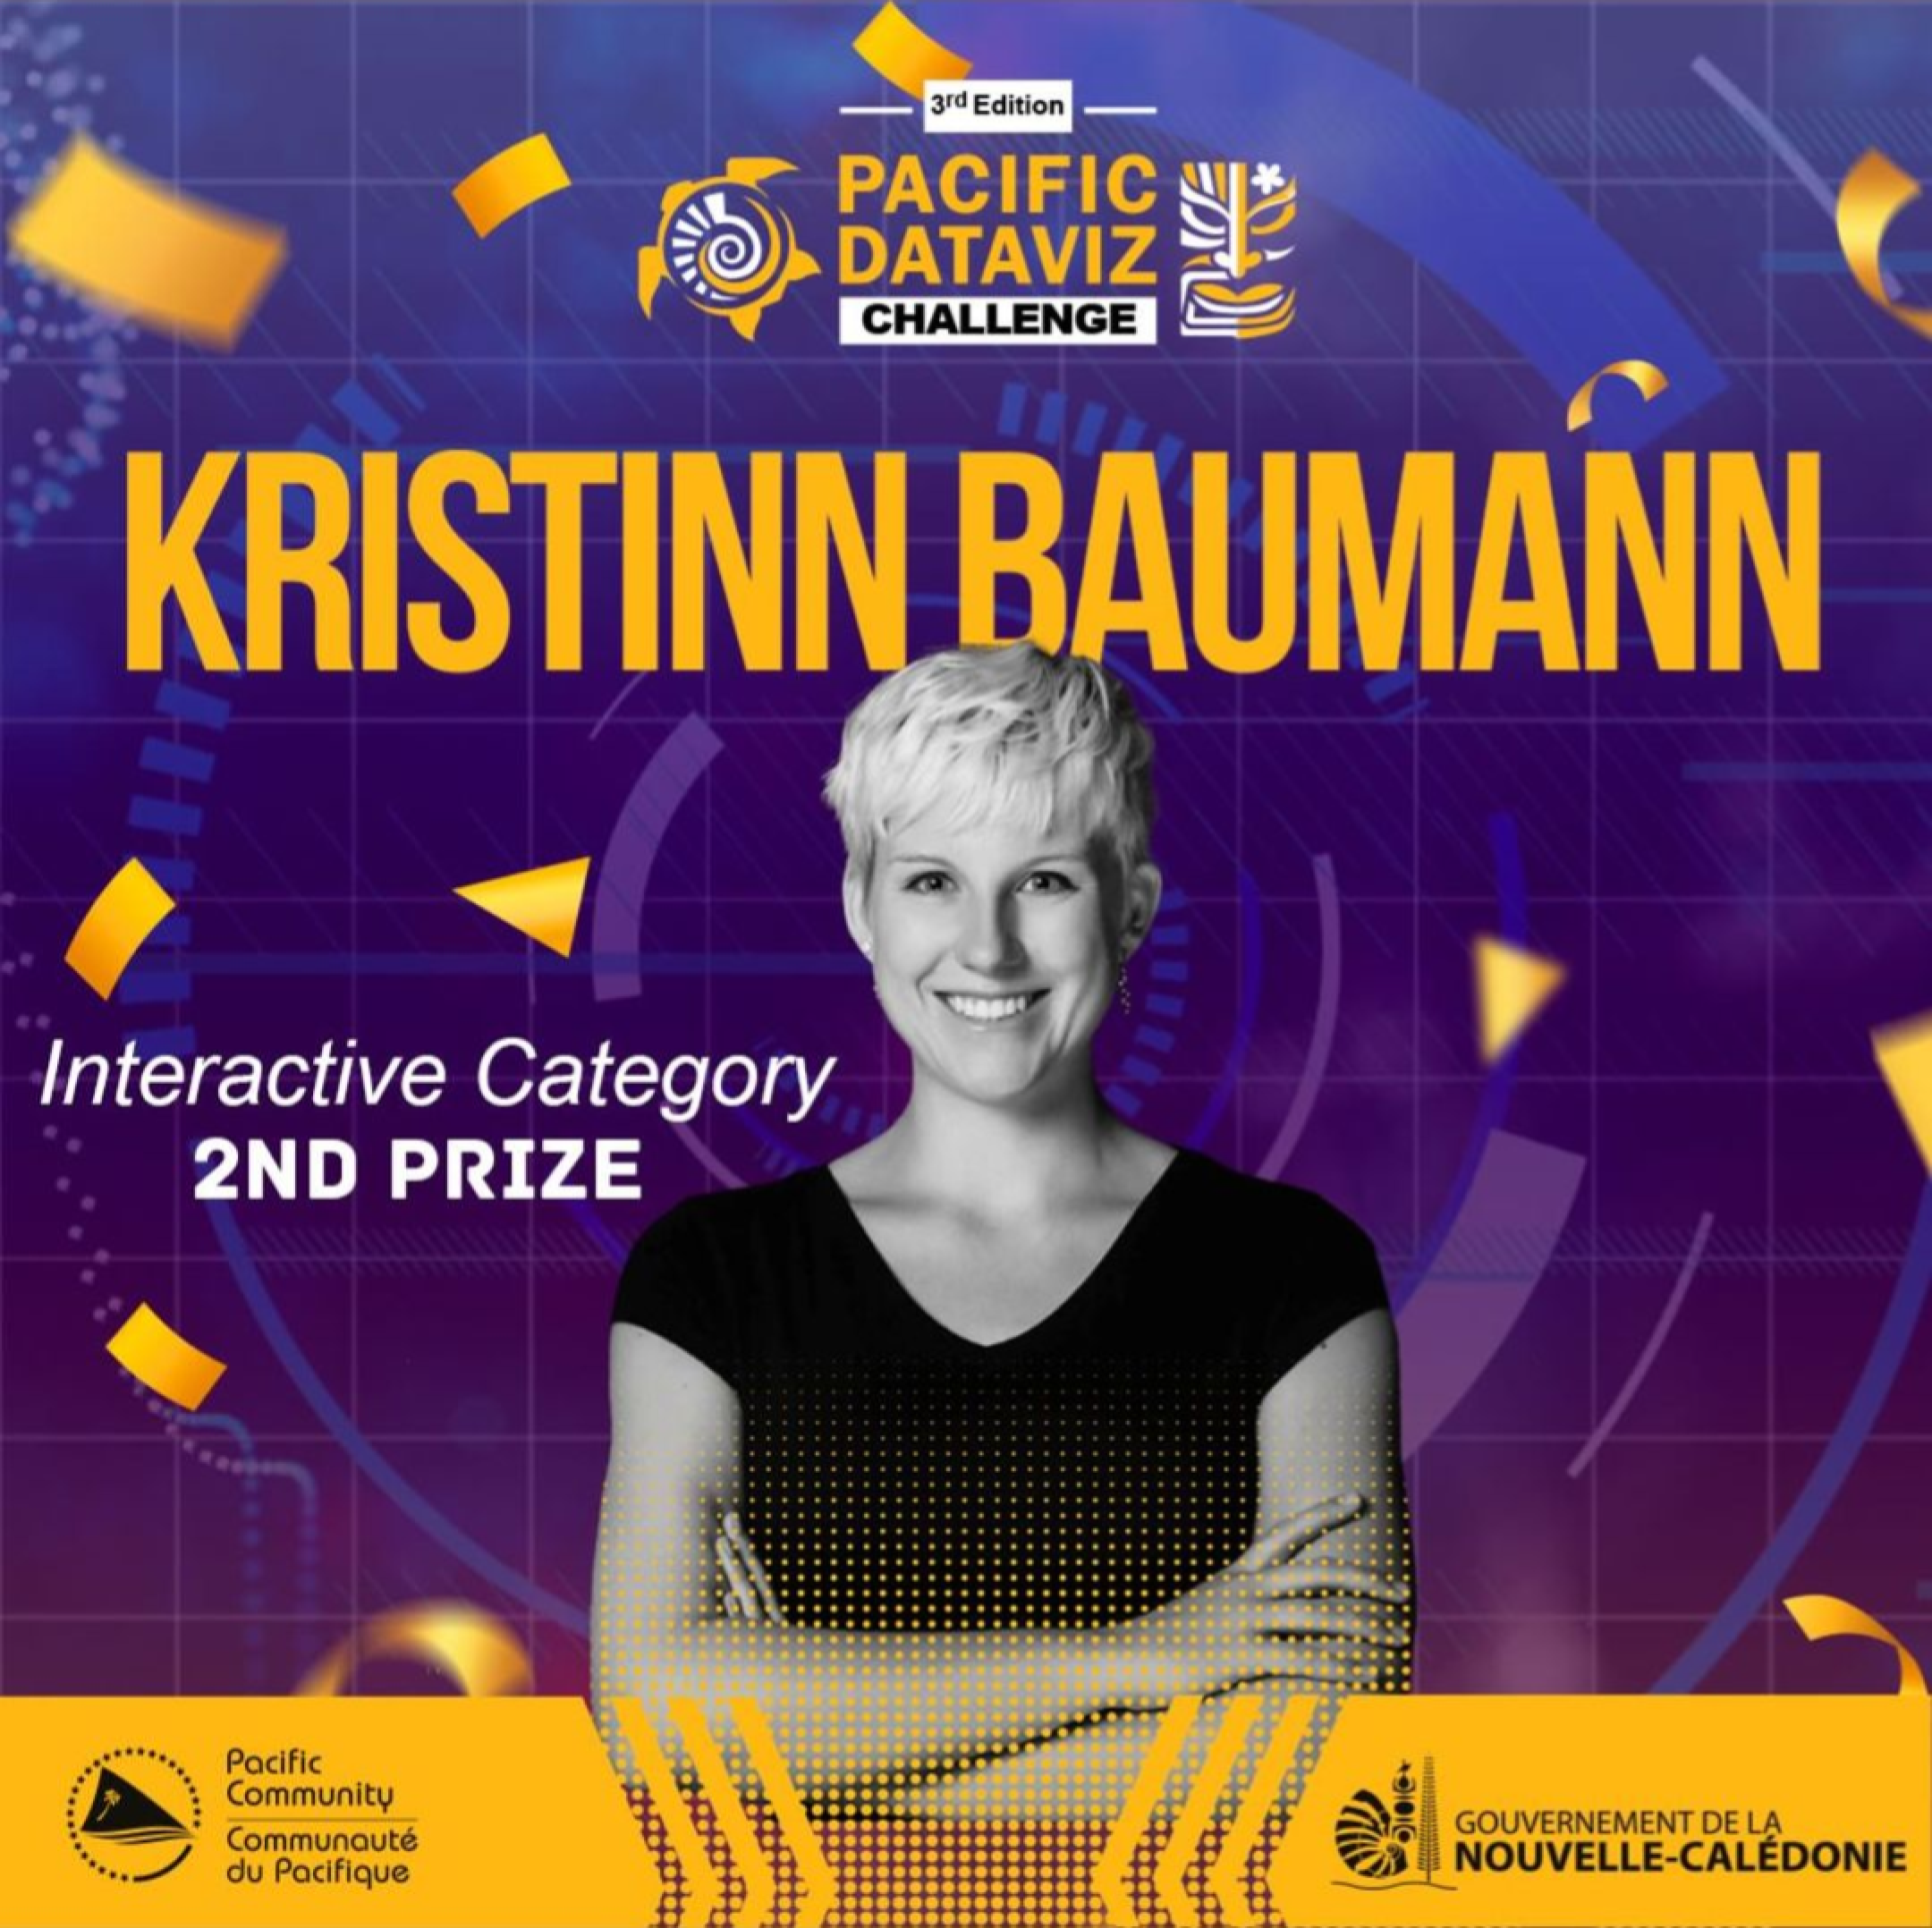
I wanted to create a data visualization with a more organic and natural look, rather than a more standard data encoding, so I am delighted that this project won the second place in the Interactive category of the Pacific Dataviz Challenge as well as a place in the Longlist of the Information is Beautiful Awards 2024. 🎉
I coded this project using Svelte and D3. Little easter egg: The generation of the plant with its leaves and blossoms is randomized, so every time you reload the website, it looks a little different.
See also
More Projects You Might Like
Inspired by what you see?
Let’s discuss how we can bring your data to life with a custom, interactive visualization.


