Scrollytelling Report: "AI Disruption Index"
An interactive, multilingual scrollytelling experience exploring how AI is reshaping consumer behaviour across industry verticals
This project is an interactive, multilingual scrollytelling report visualizing findings from the AI Disruption Index study by Moloco and Boston Consulting Group (BCG). It transforms survey insights from marketing leaders and first-party Moloco data into an accessible narrative about how AI is reshaping consumer behaviour across industry verticals.
Using Next.js within Webflow Cloud, I implemented the concept and design created by the leading agency, Parabole Studio. I developed the central interactive data visualization using D3.js, the scrollytelling functionality with GSAP, and the background visuals with p5.js.
2025/2026
Moloco (via Parabole Studio)
Parabole Studio
Data Storytelling (Scrollytelling Website)
Development
Next.js (React) on Webflow Cloud, D3.js, p5.js, GSAP, Tailwind
I really enjoyed coding this project because the page content was thoughtfully crafted and professionally designed. It included a bunch of interesting coding puzzles, like:
- a subtly animated background consisting of dots,
- a small lollipop chart in the detail section,
- a flipping card-turning animation for the details view,
- making everything work for multiple languages,
- optimizing the scrolling behaviour across many devices and browsers,
- using Webflow Cloud to integrate into the existing ecosystem.
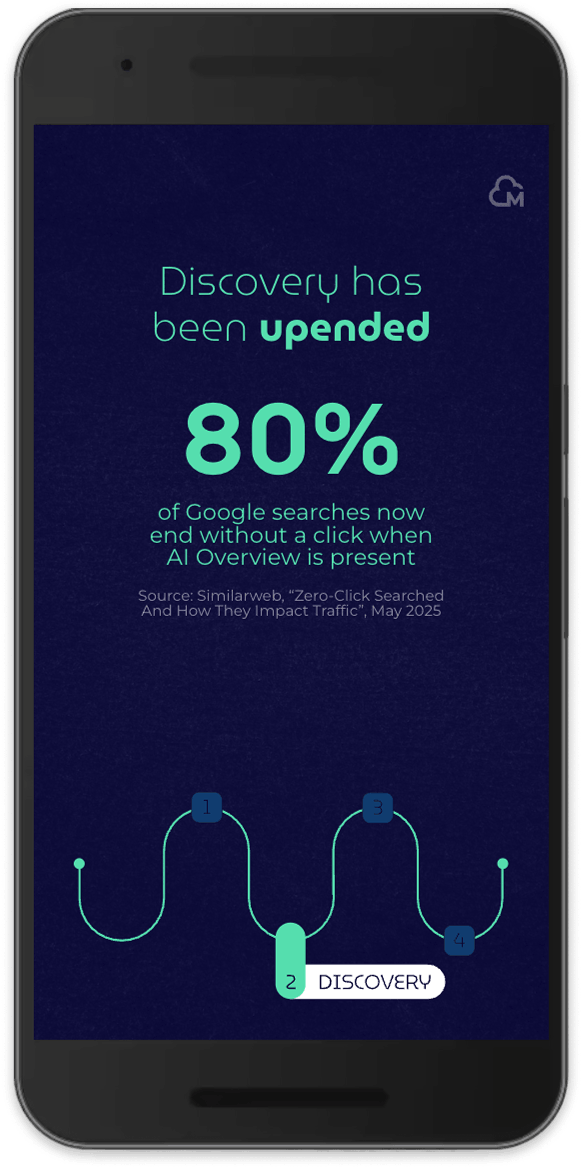
The scrollytelling starts with an introduction in how consumer journeys change in the era of AI. I personally find this survey insight especially interesting and a bit alarming: 80% of Google searches end without a click when an AI overview is present.
The main interactive visualization then provides a deep dive into how exposed brands are to AI-driven disruption and the strength of their customer relationships, which allows for the exploration of the risks and opportunities per vertical. I particularly liked the challenge of making the website and this more elaborate chart work well on mobile devices as well.
The scrollytelling site then concludes with strategies for marketers to survive and thrive with the change that AI brings while finding and retaining customers. The project was localized for a global audience, with translations available in Korean, Chinese, and Japanese.
See also
More Projects You Might Like
Inspired by what you see?
Let’s discuss how we can bring your data to life with a custom, interactive visualization.


