Real-time Crypto Data Visualized on a LED Sphere
An immersive installation turning complex crypto data into an engaging, real-time visual experience
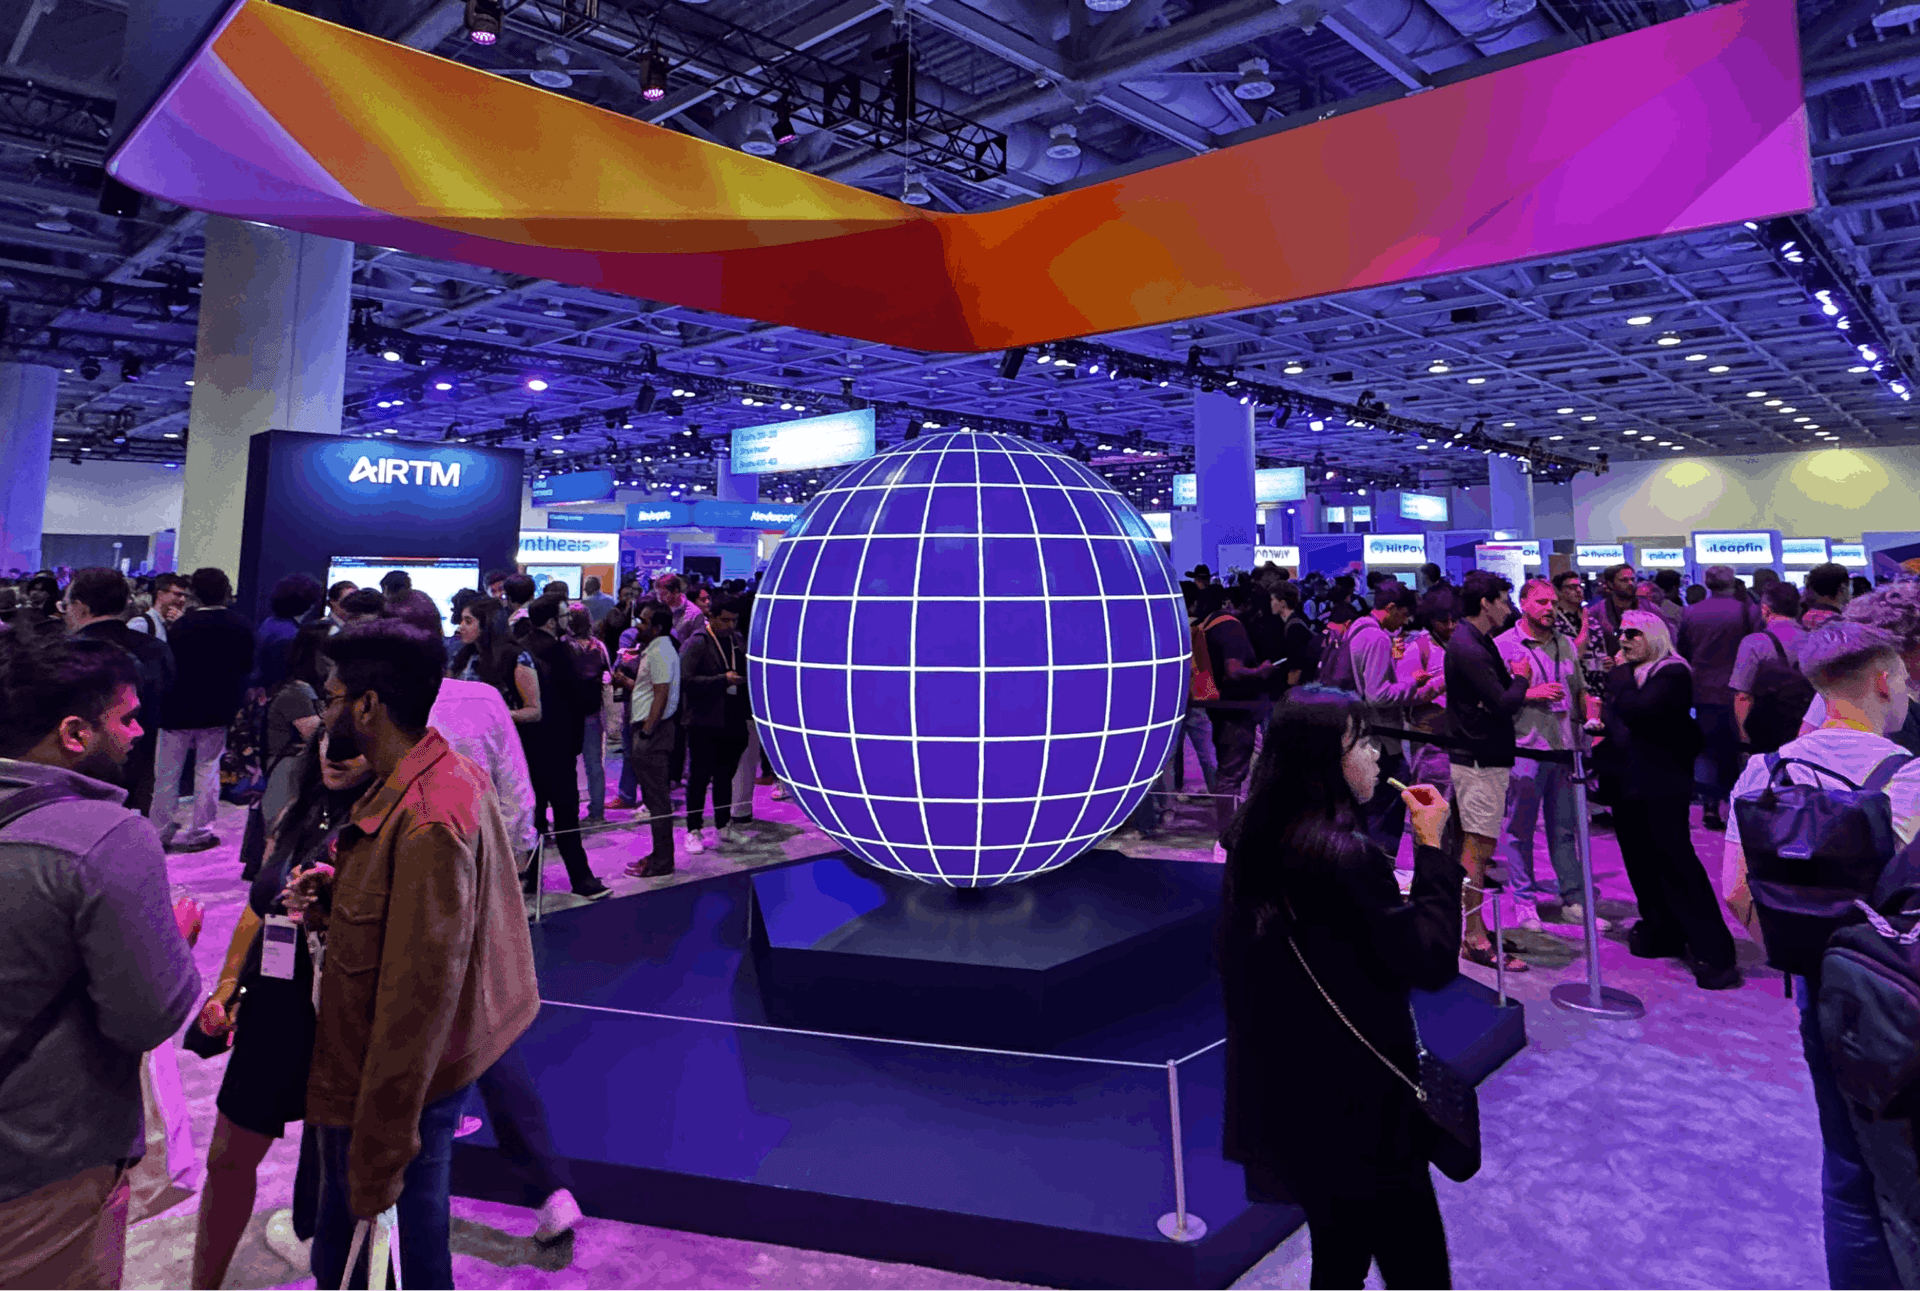
I collaborated with Wesley Grubbs (Pitch Interactive) and Nick Harbaugh to create a 2-meter LED sphere that visualized real-time stablecoin transactions at the Stripe Sessions conference.
My primary focus was on backend development, ensuring seamless real-time data processing that allowed attendees to see their actions, like coffee purchases, reflected on the sphere within milliseconds.
This project was a thrilling blend of backend engineering and creative storytelling, and I’m incredibly proud to have helped bring it to life.
2025
Stripe (Sessions Conference 2025)
Pitch Interactive
Immersive Physical Data Experience
Coding Backend & Real-Time Data Connection
React, Typescript, P5.js, D3.js, Three.js, Express, Vercel, Postgres, Pusher
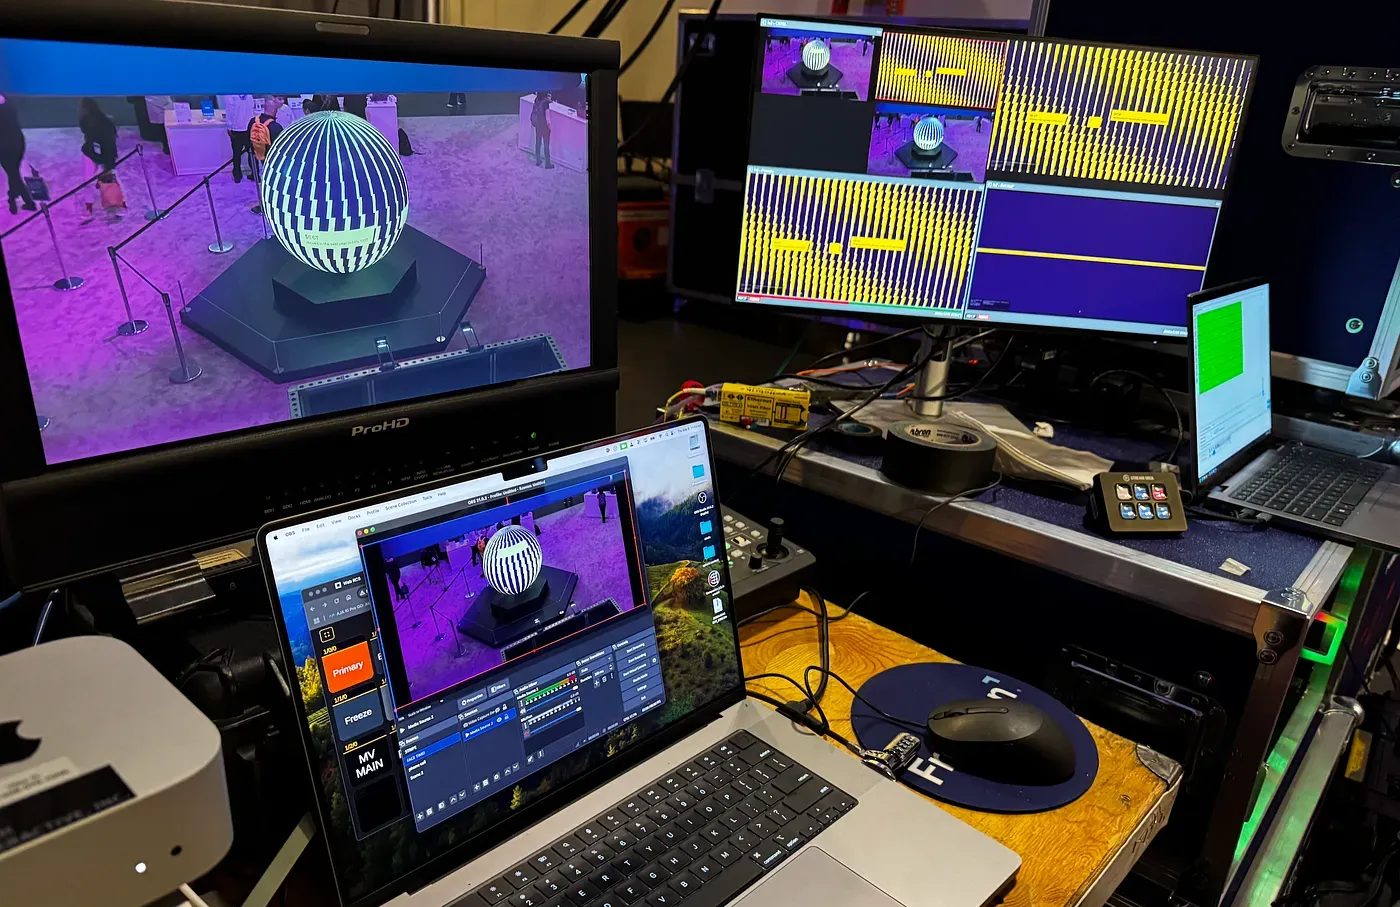
Video created by Nick Harbaugh
Video of the installation during conference setup showing a few of the visual states
When Wesley approached me about working on a visual installation with a massive 2-meter sphere, I knew this would be no ordinary project. I had wanted to create a physical data visualization for quite some time, so I was very excited about the opportunity to work with Wesley and Nick to make this project a reality.
Most of the time in my freelance work as a Data Vis Developer, I am responsible for data handling on the backend side and visual aspects on the frontend. But with an extensive real-time data flow required and a short timeline, I was happy to focus primarily on the backend work in this project.
Aggregating data on stablecoins was really interesting, because the magnitude of the data points is just so unfathomable, being in the millions and billions. But the heart of the project for me evolved around the real-time events that allowed conference attendees to see their coffee purchases on the sphere within milliseconds. This immersive experience of a real-life action appearing in a visualized installation is what makes a real-time, physical data visualization so fascinating to me.
The tech stack included React with Typescript for the frontend, P5.js for dynamic animations, D3.js for complex data visualizations, Three.js for testing and development, Motion (formerly Framer Motion) as the animation library, Express for the backend, Vercel for deployment and hosting, and a Postgres database on Supabase for data storage.
Read the detailed blog post about it here: https://blog.kristin-baumann.com/creating-an-immersive-physical-data-visualization-with-real-time-data/
See also
More Projects You Might Like
Inspired by what you see?
Let’s discuss how we can bring your data to life with a custom, interactive visualization.


