In 2024, I participated in the Du Bois Challenge and reproduced 10 historical data visualizations over the course of 10 weeks.
The goal of this challenge is to celebrate the data viz legacy of W.E.B Du Bois-a Black American civil rights activist, sociologist, and writer-by recreating the visualizations from the 1900 Paris Exposition using modern tools.
2024
Coding
D3.js, Svelte, QGIS
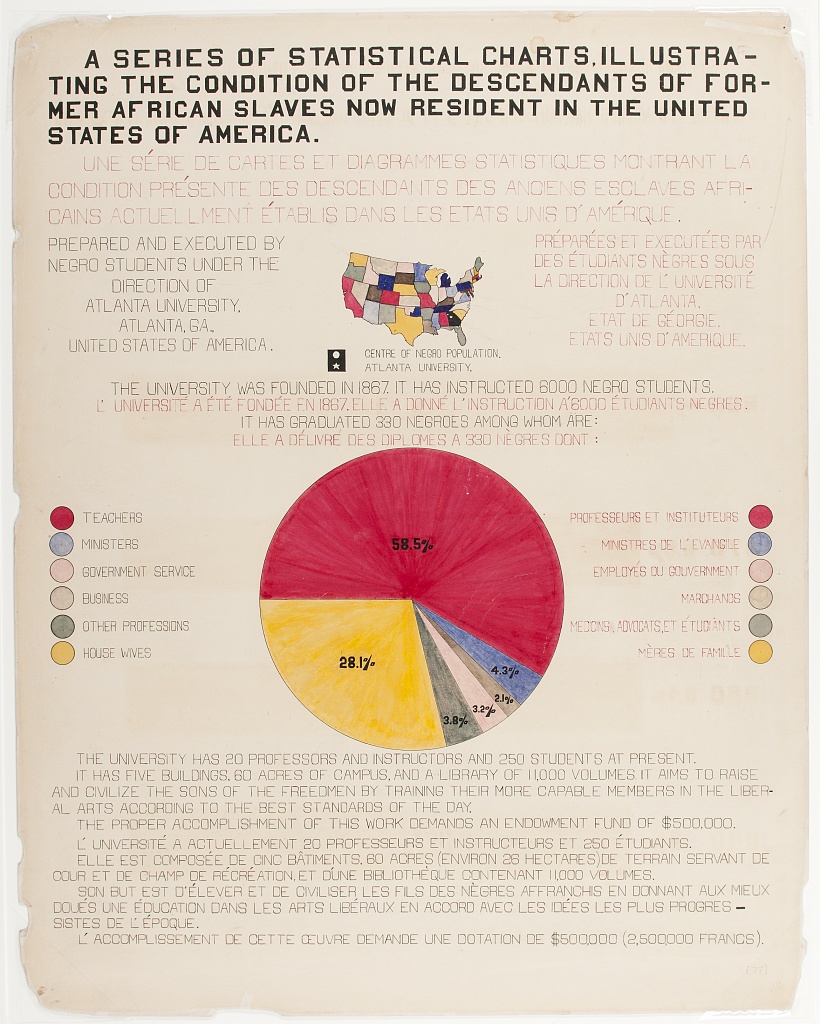
Original plate number 37 by W.E.B. Du Bois
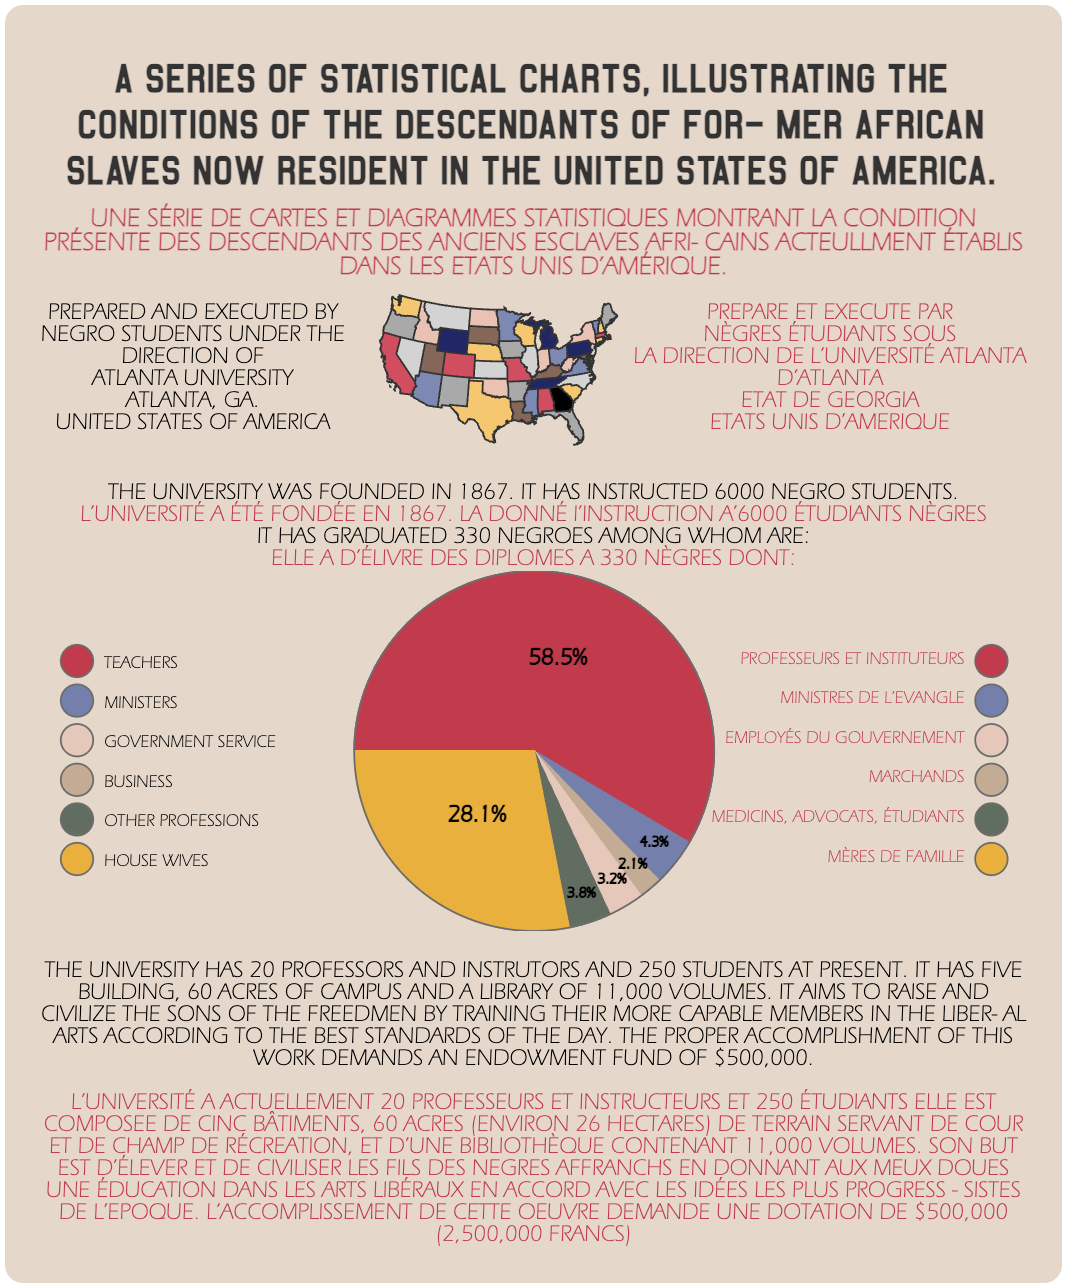
Recreated plate nr. 37 using D3.js and Svelte
To recap, I wrote an article in the Nightingale magazine of the Data Visualization Society about my experience in the Du Bois Challenge from a technical point of view and collected some tips for recreating historical data viz.
You can find my code on Github.
See also
More Projects You Might Like
Inspired by what you see?
Let’s discuss how we can bring your data to life with a custom, interactive visualization.