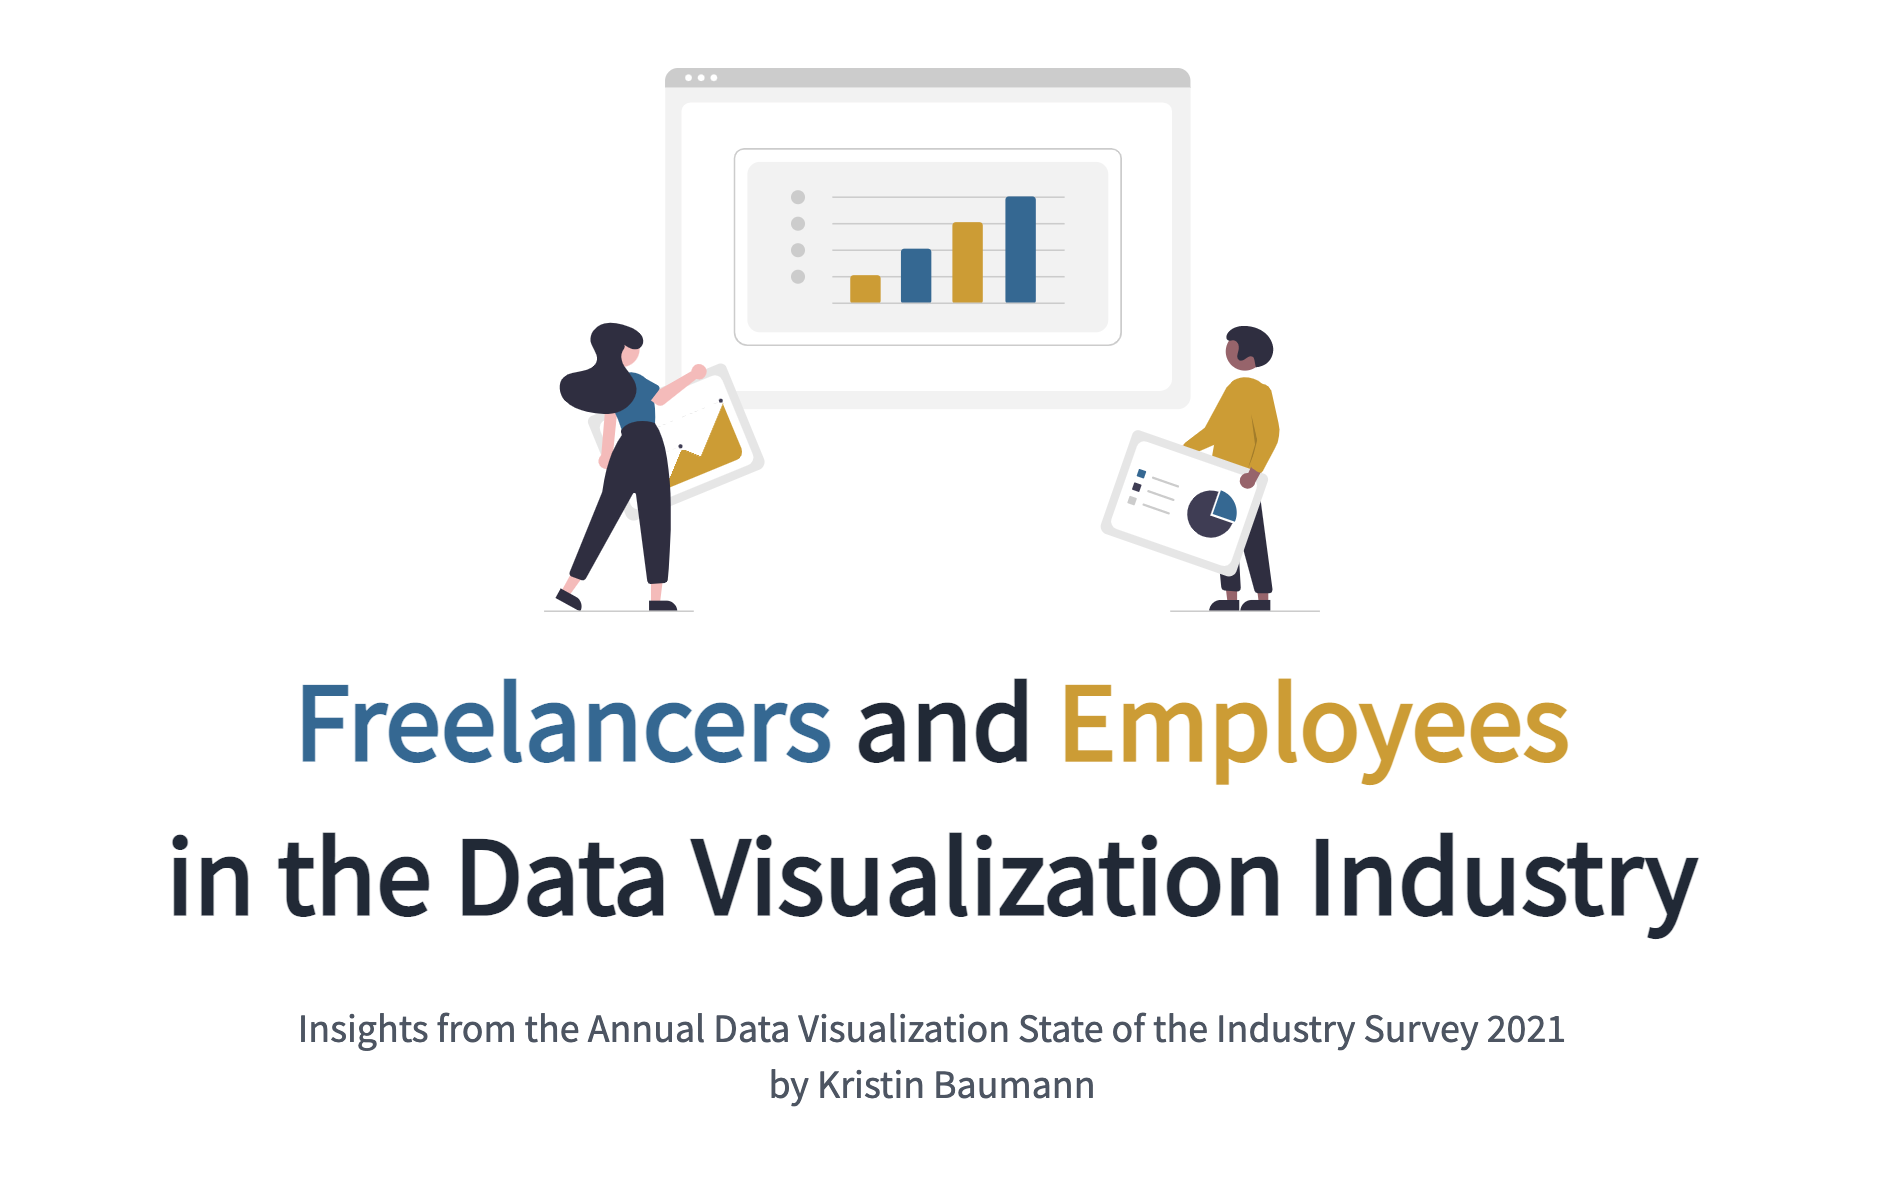
The website's hero component

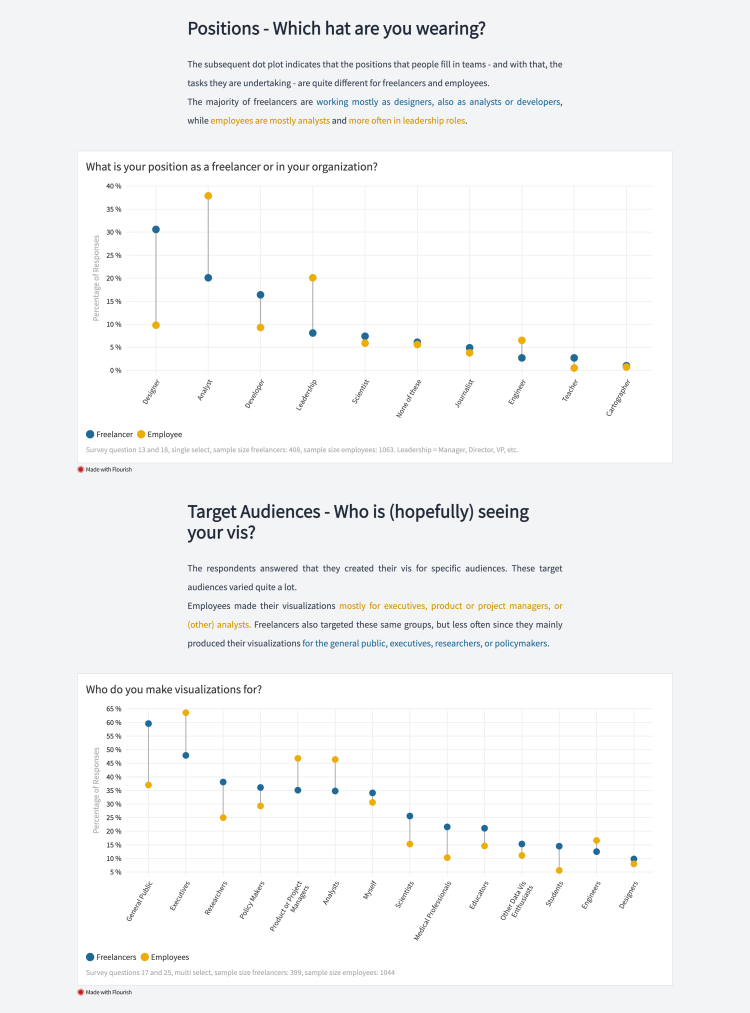
Two aspects of the analysis: data vis positions and target audiences

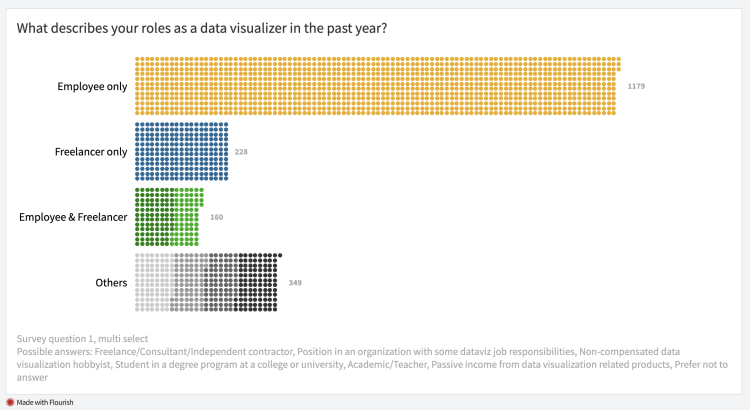
Dot plot of the distribution of employees or freelancers in the data set

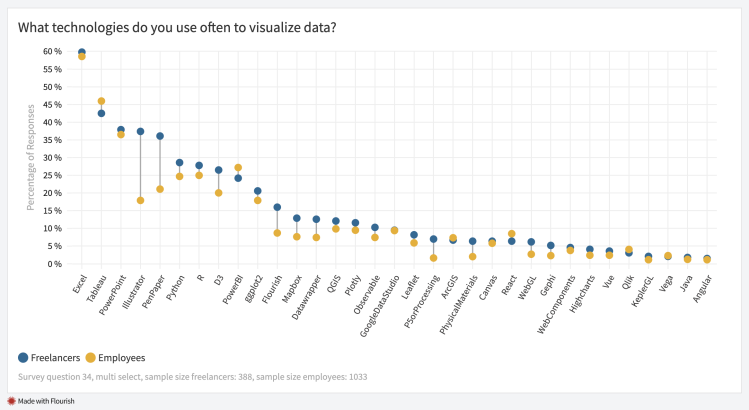
View of a chart describing the used technologies. Made with Flourish.
Year: 2022
Roles: Ideation, Data Analysis, Data Visualisation, Texting, Website Implementation
Tech: NodeJS, Flourish, React, Gatsby, TailwindCSS
Wherever you look, data is getting collected in one way or another. Therefore the need to find insights in large data sets and make them easily understandable using visualizations is constantly on the rise. More people are joining the data visualization industry and have to decide how they want to work in it. So what are the differences between freelancers and employees?
This analysis based on results from the Annual Data Visualization State of the Industry Survey conducted by the Data Visualization Society will provide some answers and might help you in the decision process on whether to join as a freelancer or an employee and evaluate possible work environments.